This study focused on the calibration of LR-115 type II solid-state nuclear track detectors (SSNTDs) and the assessment of indoor radon-222 concentrations in dwellings in Man, Côte d’Ivoire. Detector calibration was performed in a certified radon chamber by exposing the LR-115 to a radon concentration of 2.29 kBq·m⁻3 for 64.33 h. After chemical etching and microscopic analysis, a calibration factor of 198.35 ± 21.43 tr/cm2/kBq·m-3·h was obtained. Twenty-six detectors were then deployed in dwellings for three months. Radon concentrations ranged from 52.13 to 219.4 Bq/m3, with an average of 119.69 ± 13.36 Bq/m3 (120 Bq.m-3). Most measured values were below internationally recommended reference levels; however, several sites (M1, M6, M9, M14 and M18) exceeded 150 Bq·m-3. Apart from geological factors, elevated concentrations were mainly associated with poor ventilation and low foundation height. Excess cancer risk (ECR), estimated using EPA and UNSCEAR coefficients, showed significant spatial variability. According to the EPA model, ECR values ranged from 32 to 98 for site M19 and from 134 to 410 for site M14, while UNSCEAR-based estimates ranged from 41 to 111 at M19 and from 174 to 469 at M14. Corresponding annual effective doses varied between 2.09 and 8.81 mSv·y-1. These findings highlight the spatial variability of indoor radon concentrations linked to local geology and building characteristics, and provide essential baseline data for radon mapping and risk mitigation strategies in Côte d’Ivoire. The results support targeted ventilation improvements and foundation design considerations within existing housing stock without altering measured.
| Published in | American Journal of Physics and Applications (Volume 14, Issue 1) |
| DOI | 10.11648/j.ajpa.20261401.11 |
| Page(s) | 1-11 |
| Creative Commons |
This is an Open Access article, distributed under the terms of the Creative Commons Attribution 4.0 International License (http://creativecommons.org/licenses/by/4.0/), which permits unrestricted use, distribution and reproduction in any medium or format, provided the original work is properly cited. |
| Copyright |
Copyright © The Author(s), 2026. Published by Science Publishing Group |
Radon-222, WHO, SSNTD LR-115, Effective Dose, Man City, Lung Cancer
Track density (tr/cm2) | Calibration factor (tr/cm2/kBq.m-3.h) |
|---|---|
29,100.00 ± 492.00 | 197.53 ± 21.00 |
30,391.66 ± 503.25 | 206.30 ± 22.26 |
28,033.00 ± 483.00 | 190.29 ± 21.00 |
29,225.00 ± 493.49 | 198.38 ± 21.39 |
29,350.24 ± 494.55 | 199.23 ± 21.49 |
kmoyen | 198.35 ± 21.43 |
Foundation height (cm) | Ventilation condition | Radon Concentration (Bq/m3) | Dose Effective (mSv/y) | |
|---|---|---|---|---|
M1 | 40 | N.V | 171.51 ± 18.92 | 6.89 ± 0.76 |
M2 | 40 | N.V | 93.23 ± 10.46 | 3.74 ± 0.42 |
M3 | 20 | N.V | 73.12 ± 8.11 | 2.94 ± 0.33 |
M4 | 80 | V | 129.34 ± 12.15 | 5.19 ± 0.49 |
M5 | 30 | V | 146.47 ± 16.06 | 5.88 ± 0.65 |
M6 | 30 | N.V | 189.34 ± 20.78 | 7.60 ± 0.83 |
M7 | 20 | V | 101.77 ± 11.25 | 4.09 ± 0.45 |
M8 | 30 | N.V | 161.97 ± 17.89 | 6.51 ± 0.72 |
M9 | 35 | N.V | 168.83 ± 18.63 | 6.78 ± 0.75 |
M10 | 50 | V | 102.18 ± 11.74 | 4.10 ± 0.47 |
M11 | 20 | V | 96.11 ± 10.68 | 3.86 ± 0.43 |
M12 | 40 | V | 131.81 ± 14.83 | 5.29 ± 0.60 |
M13 | 40 | N.V | 92.58 ± 10.36 | 3.72 ± 0.42 |
M14 | 20 | N.V | 219.4 ± 24.59 | 8.81 ± 0.99 |
M15 | 30 | N.V | 69.24 ± 8.37 | 2.78 ± 0.34 |
M16 | 10 | N.V | 121.8 ± 13.43 | 4.89 ± 0.54 |
M17 | 10 | V | 91.5 ± 10.58 | 3.68 ± 0.42 |
M18 | 50 | N.V | 194.99 ± 21.95 | 7.83 ± 0.88 |
M19 | 80 | V | 52.13 ± 6.31 | 2.09 ± 0.25 |
M20 | 40 | N.V | 73.47 ± 8.12 | 2.95 ± 0.33 |
M21 | 50 | N.V | 68.03 ± 7.67 | 2.73 ± 0.31 |
M22 | 60 | N.V | 147.72 ± 16.26 | 5.93 ± 0.65 |
M23 | 30 | V | 85.56 ± 9.52 | 3.44 ± 0.38 |
M24 | 40 | N.V | 181.64 ± 19.92 | 7.30 ± 0.80 |
M25 | 60 | V | 58.39 ± 6.56 | 2.35 ± 0.26 |
M26 | 50 | N.2V | 87.98 ± 9.93 | 3.53 ± 0.40 |
Average | 119.69 ± 13.36 | 4.81 ± 0.54 |
Sites | Radon Concentration (Bq/m3) | Radiological risk | ECR | |
|---|---|---|---|---|
EPA | UNSCEAR | |||
M1 | 171.51 ± 18.92 | (5.32 ± 0.53)10-4 | 105 - 328 | 137 - 374 |
M2 | 93.23 ± 10.46 | (2.62 ± 0.29)10-4 | 57 - 182 | 74 - 207 |
M3 | 73.12 ± 8.11 | (2.06 ±0.23)10-4 | 45 - 137 | 58 - 156 |
M4 | 129.34 ± 12.15 | (3.64 ± 0.34)10-4 | 80 - 245 | 104 - 280 |
M5 | 146.47 ± 16.06 | (4.12 ±0.45)10-4 | 89 - 274 | 116 - 313 |
M6 | 189.34 ± 20.78 | (5.32 ±0.53)10-4 | 116 - 354 | 150 - 405 |
M7 | 101.77 ± 11.25 | (2.86 ± 0.31)10-4 | 62 - 190 | 81 - 217 |
M8 | 161.97 ± 17.89 | (4.55 ± 0.50)10-4 | 99 - 303 | 128 - 346 |
M9 | 168.83 ± 18.63 | (4.75 ±0.52)10-4 | 103 - 316 | 134 - 361 |
M10 | 102.18 ± 11.74 | (2.87 ±0.33)10-4 | 62 - 191 | 81 - 218 |
M11 | 96.11 ± 10.68 | (2.70 ±0.30)10-4 | 59 - 180 | 76 - 205 |
M12 | 131.81 ± 14.83 | (3.71 ± 0.41)10-4 | 81 - 247 | 105 - 282 |
M13 | 92.58 ± 10.36 | (2.60 ± 0.29)10-4 | 57 - 173 | 73 - 198 |
M14 | 219.4 ± 24.59 | (6.17 ± 0.69)10-4 | 134 - 410 | 174 - 469 |
M15 | 69.24 ± 8.37 | (1.95 ± 0.35)10-4 | 42 - 130 | 55 - 148 |
M16 | 121.8 ± 13.43 | (3.42 ± 0.38)10-4 | 74 - 228 | 97 - 260 |
M17 | 91.5 ± 10.58 | (2.57 ±0.30)10-4 | 56 - 171 | 73 - 196 |
M18 | 194.99 ± 21.95 | (5.48 ± 0.61)10-4 | 119 - 365 | 155 - 417 |
M19 | 52.13 ± 6.31 | (1.47 ± 0.18)10-4 | 32 - 98 | 41 - 111 |
M20 | 73.47 ± 8.12 | (2.07 ± 0.23)10-4 | 45 - 137 | 58 - 157 |
M21 | 68.03 ± 7.67 | (1.91 ± 0.22)10-4 | 42 - 127 | 54 - 145 |
M22 | 147.72 ± 16.26 | (4.15 ± 0.46)10-4 | 90 - 276 | 117 - 316 |
M23 | 85.56 ± 9.52 | (2.41 ± 0.27)10-4 | 52 - 160 | 68 - 183 |
M24 | 181.64 ± 19.92 | (5.11 ± 0.56)10-4 | 111 - 340 | 144 - 388 |
M25 | 58.39 ± 6.56 | (1.64 ± 0.18)10-4 | 36 - 109 | 46 - 125 |
M26 | 87.98 ± 9.93 | (2.47 ± 0.28)10-4 | 54 - 165 | 70 - 188 |
Average | 73-224 | 95-256 | ||
Agencies/Countries | Radon concentration limits in the dwellings (Bq /m3) |
|---|---|
Canada | 200 |
WHO | From 100 to 300, with an average value of 200 |
ICPR 103 | 300 |
EPA (USA) | 150 |
Europ Union (EU) | 200 |
Our results | 120 |
Average value mesured in Yopougon [5 ] | 93 |
Average value mesured in Abobo [ 13] | 113 |
Average value mesured in Boundiali [4 ] | 333 |
Average value mesured in Aboisso [4 ] | 144 |
Average value mesured in Dimbokro [4 ] | 87 |
Average value mesured in San-Pedro [ 14] | 169 |
Average value mesured in Treichville [ 15] | 139 |
Author | Year | Country | Measurement period (days) | No. of dwellings | Average radon concentration (Bq/m3) |
|---|---|---|---|---|---|
Mosupya and al | 2019 | South Africa | 90 | 5 | 105 |
90 | 7 | 41 | |||
Kgabi and al | 2009 | South Africa | 21 | 1 | 1115.92 |
25 | 1 | 1704.22 | |||
Ndjana and al | 2019 | Cameroon | 90 | 26 | 134 |
90 | 20 | 131 | |||
Opoku-Ntim and al | 2019 | Ghana | 180 | 40 | 101.35 |
Our results | 2025 | Côte d’Ivoire | 90 | 26 | 120 |
ARSN | Radiation Protection, Nuclear Safety and Security |
IARC | International Agency for Research on Cancer |
ICRP | International Commission on Radiological Protection |
IREN | Institute for New Energies Research |
LASMES | Laboratory for Matter, Environmental and Solar Energy Sciences |
LR-115 | Lexan Resin 115 |
M | Man (city) |
Max | Maximum |
Min | Minimum |
mSv | Millisevert |
NaOH | Sodium Hydroxide |
NIS | National Institute of Statistics |
NV | Not Ventilated |
PAE | Potential Alpha Energy |
Rn-222 | Radon-222 |
SSNTD | Solid-State Nuclear Track Detectors |
UFHB | University Felix Houphouet Boigny |
UNA | University Nangui Abrogoua |
V | Ventilated |
WHO | World Health Organization |
| [1] |
WHO (World Health Organization), (2009). "Radon and health”.
https://www.who.int/news-room/fact-sheets/detail/radon-and-health |
| [2] | IRSN, Radon: Properties, Sources, and Hazards, 2022. |
| [3] | International Agency for Research on Cancer (IARC), Monographs on the evaluation of carcinogenic Risks to Humans, Vol 43, Man-made Mineral Fibres and radon (1988). |
| [4] | D. S. I Agba, Measurements of radon volumetric activity using LR 115 solid-state nuclear track detectors in the cities of Boundiali, Aboisso, and Dimbokro. Doctoral thesis in Physics, Felix Houphouet-Boigny University of Cocody, (Côte d’Ivoire) (2017). |
| [5] | G. R. Nonka, T. P.A. Dali, A. A. Koua, B. D.L. H. Gogon, G. A. Monnehan, K. Djagouri, Dosimetric impact of indoor radon gas on the population from the commune of Yopougon, Abidjan, Côte d’Ivoire. Journal of Radiation Research and Applied Sciences 10 (2017) 295-300. |
| [6] | Yapo Assi Martial, Geophysical and Geotechnical Characterization of Potential Granite Rock Quarry Sites in the Ivorian Birimian: A 3D Modeling Attempt, Felix Houphouet-Boigny University, 2024. Français.NNT: 2024ICME2782. |
| [7] | Turtiainen, T., Laine, J.-P., Rantanen, S., & Oinas, T. Nonlinear Calibration and Temperature Sensitivity of Makrofol Solid-State Nuclear Track Detectors for Radon Measurement. Atmosphere, 15(10), 1179 (2024). |
| [8] | Rutherford, E. (1908). "The existence of an element with radioactive properties." Nature, 81(2105), 140-141. |
| [9] |
National Institute of Statistics (NIS), RGPH 2021, Global results.
www.plan.gouv.ci/assets/fichier/RGPH2021-RESULTATS-GLOBAUX-VF.pdf |
| [10] | Smith, D., Jones, A., & Roberts, M. (2003). Estimates of lung cancer risk in miners and their extrapolation to the general population. Environmental Health Perspectives, 111(12), 1483-1490. |
| [11] | ICRP, 1993. Protection against radon-222 at home and at work. ICRP Pubtication 65. Ann ICRP 23(2). |
| [12] | A. A. Matiullah, S. Rehmahn, and M. L. Mirza, Indoor radon levels and lung cancer risk estimates in seven cities of the Bahawalpure Division, Pakistan Radiation Protection Dosimetry, 107 (2003), P269-276. |
| [13] | K. J. F. N’Guessan et al; Indoor Radon Measurement and Excess Lung Cancer Rick. Evaluation in the District of Abidjan: The Case of the Commune of Abobo (Côte d’Ivoire); Int. j. Pure Appl.Sci.Technol., pp. 46-56(2016). |
| [14] | KINI Alla (2017), Seasonal Variation Study of Indoor Radon Concentration in Dwellings in the City of San Pedro Master’s Program in Physics at Félix Houphouet Boigny University, Abidjan, specialization: Nuclear Science and Technology. |
| [15] | Kouakou Kouassi Jeremie (2022), Assessment of Radon Concentration in Residential Buildings of Treichville Municipality, Master’s Program in Physics at Félix Houphouet Boigny University, Abidjan, specialization: Nuclear Science and Technology. |
| [16] | Phoka C. Rathebe, Lerato Khosi & Mota Kholopo (2025) Indoor Concentration of Radon in Residential Houses Proximal to Gold Mine Tailings – A Review of Sub-Saharan Africa Studies, Environmental Forensics, 26:3, 368-379, |
APA Style
Nonka, G. R., Koua, A. A., Oka, N. G. L. (2026). Calibration of LR-115 Type II SSNTDs and Indoor Radon-222 Assessment in Man, Côte d'Ivoire. American Journal of Physics and Applications, 14(1), 1-11. https://doi.org/10.11648/j.ajpa.20261401.11
ACS Style
Nonka, G. R.; Koua, A. A.; Oka, N. G. L. Calibration of LR-115 Type II SSNTDs and Indoor Radon-222 Assessment in Man, Côte d'Ivoire. Am. J. Phys. Appl. 2026, 14(1), 1-11. doi: 10.11648/j.ajpa.20261401.11
@article{10.11648/j.ajpa.20261401.11,
  author = {Gnionnihindjoue Romaric Nonka and Aka Antonin Koua and N’guessan Guy Leopold Oka},
  title = {Calibration of LR-115 Type II SSNTDs and Indoor Radon-222 Assessment in Man, Côte d'Ivoire},
  journal = {American Journal of Physics and Applications},
  volume = {14},
  number = {1},
  pages = {1-11},
  doi = {10.11648/j.ajpa.20261401.11},
  url = {https://doi.org/10.11648/j.ajpa.20261401.11},
  eprint = {https://article.sciencepublishinggroup.com/pdf/10.11648.j.ajpa.20261401.11},
  abstract = {This study focused on the calibration of LR-115 type II solid-state nuclear track detectors (SSNTDs) and the assessment of indoor radon-222 concentrations in dwellings in Man, Côte d’Ivoire. Detector calibration was performed in a certified radon chamber by exposing the LR-115 to a radon concentration of 2.29 kBq·m⁻3 for 64.33 h. After chemical etching and microscopic analysis, a calibration factor of 198.35 ± 21.43 tr/cm2/kBq·m-3·h was obtained. Twenty-six detectors were then deployed in dwellings for three months. Radon concentrations ranged from 52.13 to 219.4 Bq/m3, with an average of 119.69 ± 13.36 Bq/m3 (120 Bq.m-3). Most measured values were below internationally recommended reference levels; however, several sites (M1, M6, M9, M14 and M18) exceeded 150 Bq·m-3. Apart from geological factors, elevated concentrations were mainly associated with poor ventilation and low foundation height. Excess cancer risk (ECR), estimated using EPA and UNSCEAR coefficients, showed significant spatial variability. According to the EPA model, ECR values ranged from 32 to 98 for site M19 and from 134 to 410 for site M14, while UNSCEAR-based estimates ranged from 41 to 111 at M19 and from 174 to 469 at M14. Corresponding annual effective doses varied between 2.09 and 8.81 mSv·y-1. These findings highlight the spatial variability of indoor radon concentrations linked to local geology and building characteristics, and provide essential baseline data for radon mapping and risk mitigation strategies in Côte d’Ivoire. The results support targeted ventilation improvements and foundation design considerations within existing housing stock without altering measured.},
 year = {2026}
}
TY  - JOUR
T1  - Calibration of LR-115 Type II SSNTDs and Indoor Radon-222 Assessment in Man, Côte d'Ivoire
AU  - Gnionnihindjoue Romaric Nonka
AU  - Aka Antonin Koua
AU  - N’guessan Guy Leopold Oka
Y1  - 2026/01/27
PY  - 2026
N1  - https://doi.org/10.11648/j.ajpa.20261401.11
DO  - 10.11648/j.ajpa.20261401.11
T2  - American Journal of Physics and Applications
JF  - American Journal of Physics and Applications
JO  - American Journal of Physics and Applications
SP  - 1
EP  - 11
PB  - Science Publishing Group
SN  - 2330-4308
UR  - https://doi.org/10.11648/j.ajpa.20261401.11
AB  - This study focused on the calibration of LR-115 type II solid-state nuclear track detectors (SSNTDs) and the assessment of indoor radon-222 concentrations in dwellings in Man, Côte d’Ivoire. Detector calibration was performed in a certified radon chamber by exposing the LR-115 to a radon concentration of 2.29 kBq·m⁻3 for 64.33 h. After chemical etching and microscopic analysis, a calibration factor of 198.35 ± 21.43 tr/cm2/kBq·m-3·h was obtained. Twenty-six detectors were then deployed in dwellings for three months. Radon concentrations ranged from 52.13 to 219.4 Bq/m3, with an average of 119.69 ± 13.36 Bq/m3 (120 Bq.m-3). Most measured values were below internationally recommended reference levels; however, several sites (M1, M6, M9, M14 and M18) exceeded 150 Bq·m-3. Apart from geological factors, elevated concentrations were mainly associated with poor ventilation and low foundation height. Excess cancer risk (ECR), estimated using EPA and UNSCEAR coefficients, showed significant spatial variability. According to the EPA model, ECR values ranged from 32 to 98 for site M19 and from 134 to 410 for site M14, while UNSCEAR-based estimates ranged from 41 to 111 at M19 and from 174 to 469 at M14. Corresponding annual effective doses varied between 2.09 and 8.81 mSv·y-1. These findings highlight the spatial variability of indoor radon concentrations linked to local geology and building characteristics, and provide essential baseline data for radon mapping and risk mitigation strategies in Côte d’Ivoire. The results support targeted ventilation improvements and foundation design considerations within existing housing stock without altering measured.
VL  - 14
IS  - 1
ER  -
Laboratory for Matter, Environmental and Solar Energy Sciences (LASMES), Felix Houphouet Boigny University (UFHB), Abidjan, Côte d'Ivoire
Biography: Gnionnihindjoue Romaric Nonka is a Nuclear Physicist and Expert in the implementation of Nuclear Safety measures, responsible for Nuclear Protection, Safety, and Security at the Authority for Radiological Protection, Safety, and Security (ARSN). Currently, I am pursuing a PhD at the Laboratory for Matter, Environmental, and Solar Energy Sciences (LASMES) at Felix Houphouet-Boigny University (UFHB) in Abidjan, Côte d’Ivoire.
Research Fields: Study of radon concentrations in the air of dwellings, Radioecology, Optimization of nuclear security measures for Major Public Events.

Laboratory for Matter, Environmental and Solar Energy Sciences (LASMES), Felix Houphouet Boigny University (UFHB), Abidjan, Côte d'Ivoire;Radiation Protection, Nuclear Safety and Security Authority (ARSN), Abidjan, Côte d'Ivoire
Biography: Aka Antonin Koua is a Full Professor specializing in nuclear physics and radiation protection at the Felix Houphouet Boigny university of Cocody in abidjan, côte d'ivoire. He is the director of radiation protection at the radiation protection authority for nuclear safety and security in côte d'ivoire. He has published several scientific articles in several journals in the field of nuclear physics.
Research Fields: Evaluation of the Radiological quality of some foods consumed and NOMRs management in Côte d’Ivoire, Study of optimization of doses.

Research Institute for New Energies (IREN), Nangui Abrogoua University (UNA), Abidjan, Côte d'Ivoire;Radiation Protection, Nuclear Safety and Security Authority (ARSN), Abidjan, Côte d'Ivoire
Biography: N’guessan Guy Leopold Oka is a nuclear physicist and a Qualified Expert in Radiation Protection. He is currently the Deputy Director of Nuclear Safety and Security of the Radiation Protection, Nuclear Safety and Security Authority (ARSN, Regulatory Body for Nuclear Safety and Security of Côte d'Ivoire) and Sworn Inspector of ARSN. He is also a Research Associate at the Laboratory of Nuclear Energy and Radiation Protection of the Institute for Research on New Energies of the University of Nangui-Abrogoua. He was Head of Radiation Protection Services at the Sub-Directorate of Protection against Ionizing Radiation (SDPRI) of the National Public Health Laboratory (LNSP) from 2002 to 2008 and then Manager of the "Radiation Protection and Environment Consulting"
Research Fields: Evaluation of the Radiological quality of some foods and drinking waters consumed in Côte d’Ivoire, Study of optimization of doses, Optimization of nuclear security measures for Major Public Events.

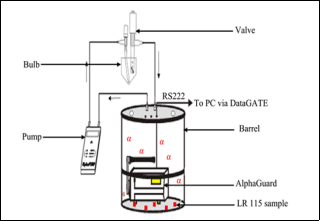
Figure 1.
Experimental Setup.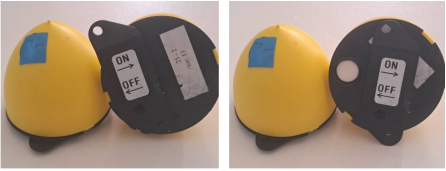
Figure 2.
Photo of the Detector in its closed cup mode, in "off" and "on" states.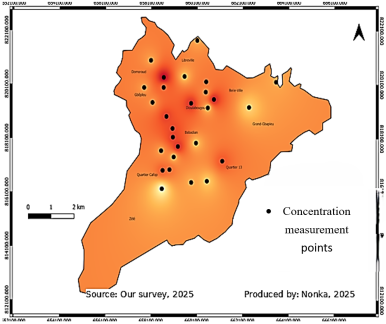
Figure 3.
Radon concentration in the city of Man.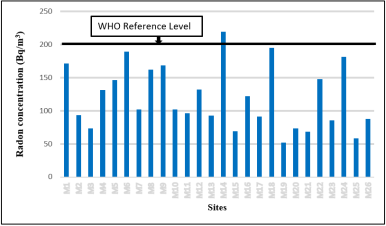
Figure 4. Distribution of radon concentration (Bq/m3) in dwellings of city of Man.
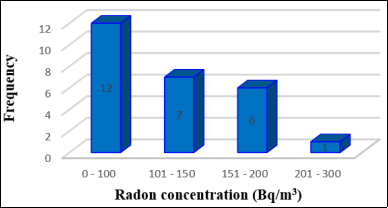
Figure 5. Frequency of radon concentration in homes at Man sites.
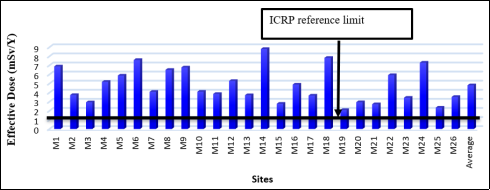
Figure 6.
Effective dose (mSv/y) according to measurement sites.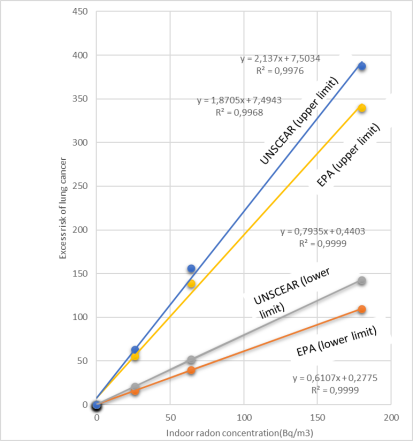
Figure 7.
Determination of the excess lung cancer risk (ECR) as a function of radon concentration [12].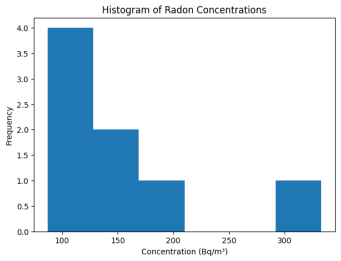
Figure 8.
Histogram of radon concentrations in selected cities in Côte d’Ivoire.